• We have updated our Community Code of Conduct. Please read through the new rules for the forum that are an integral part of Paradox Interactive’s User Agreement.

Victoria 3 - Dev Diary #29 - User Experience

16_9.jpg

Hello, my name is Henrik and I am a UX Designer on PDS. I have been a part of the Victoria 3 team for almost the entirety of the project, and since I am about to take a few months of parental leave I wanted to leave you with a brief summary and overview of the thoughts and ideas that form the foundation of the User Experience (UX) design in our game. Also, say hello to Aron whom I have written this dev diary in cooperation with. Aron has been my UX padawan for the past year and will be shouldering the UX while I am gone.

First and foremost, why do we do what we do? Basically, our end goal is to make the game more approachable and accessible, so that we can make it even deeper and more complex. Complexity should not come from not knowing where to find something and why something happened, but from the deep simulation and game mechanics at the core of our game. The more accessible the information and interactions can be, the more complex we can make that information and those interactions.

In order to get there, we have three UX Pillars

  1. The right information at the right time
  2. Clear feedback about cause and effect
  3. Clearly separate Actions from Information

What tools do we have at our disposal to provide a user experience that satisfies these lofty goals? In this Dev Diary we will walk you through some of our main tools and approaches.

Nested tooltip, as made famous by Crusader Kings 3​

There is one piece of technology we can not see this game without: Nested Tooltips. We use it both for Game Concepts, and for getting more detailed breakdowns of numbers, and boy do we have numbers! This allows us to achieve parts of the first UX Pillar, The Right information at the right time. Instead of having to explain every single detail and anecdote in a single humongous tooltip, we can focus on the most essential and important information for the current context and leave any information that might not be directly tied to this context for the nested tooltips to cover. This is crucial in Victoria 3 where every single thing affects a whole bunch of other things, some very important and others simply knock on effects.

DD29 01 concept v2.png


DD29 02 numbers v2.png


Of course Nested Tooltips come with their own set of challenges. This is where we are happy to allow for a lot of customization and tweaking. For example, how do you want the tooltip to lock? Mouse Tendency, Timer Lock, or Action Lock? If you choose the Timer Lock, how long do you want that timer to be? Etc.

DD29 03 menu tooltip.png

Another thing we show in these tooltips is the next thing on the agenda and what y’all been waiting for - graphs!

Data visualization​

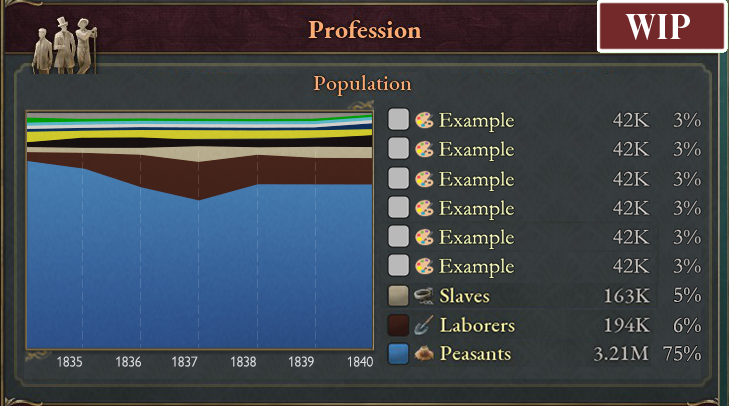
One of the more challenging areas is to clearly give feedback of a value’s change over time. In a game with as many interlocking systems as Victoria, giving feedback on how something has changed over time becomes an essential part of the game-loop. How can we take several values and show you exactly how it has changed over time? You guessed it, line graphs.

DD29 04 Graph.png


We would never make a Victoria game without the proper amount of graphs and charts! (Yes, you can switch to show pie charts for the Victoria 2 purists.)

DD29 05 area chart.png


DD29 06 pie chart.png

Numbers that update in real time and Predictions​

In most cases in our previous games, you have to tick the game in order to see the effects of things. In Victoria, we try to make all the immediate effects of your actions available the second you take them. When taking actions that have consequences spreading far and wide throughout the game's systems, it can be really hard to parse if this is a good idea or not without excessive use of spreadsheet software. So we predict things for you. (With a nested tooltip breakdown of that prediction value of course!)

The Building panel provides you with all the raw building data you could ever need, for you to analyze however you like. For whatever action you may desire, we provide our warmest support in your calculating endeavors with predictions such as the Weekly Balance when changing Production Method and predicted Earnings of the building if you were to expand it.
DD29 07 Building details.png


DD29 08 Production Methods tooltip.png


DD29 09 coal mine.png

Focus on the Map​

Our map is gorgeous and we want to put more emphasis on it. For example, all Events in the game have a location on the Map, and if you hover over a State name in any text, that State will be highlighted on the Map. This makes it easier to connect the names of things with their representation on the map, giving context to the text and the map. However, one of the coolest contextual information we are creating are Map Modes. We have Map Modes connected to most of our information panels, triggering when you open each panel which gives you the right contextual information at the right time. With the use of icons, numbers, and different heatmaps, we enable you to see several layers of contextual information at the same time without things getting too cluttered and without you having to scroll through a big sheet of data. Albeit, all Map Modes also exist in list form, making it possible to sort the information that is shown on the map, not entirely unlike a visual Ledger.

DD29 10 Fabric goods heatmap.png

The Lenses​

Every action you can take on the map, you can take from the five Lenses. Production Lens, Political Lens, Diplomatic Lens, Military Lens, and Trade Lens - each Lens comes with its own Map Mode! Basically, it is like viewing your country from a specific point of view.
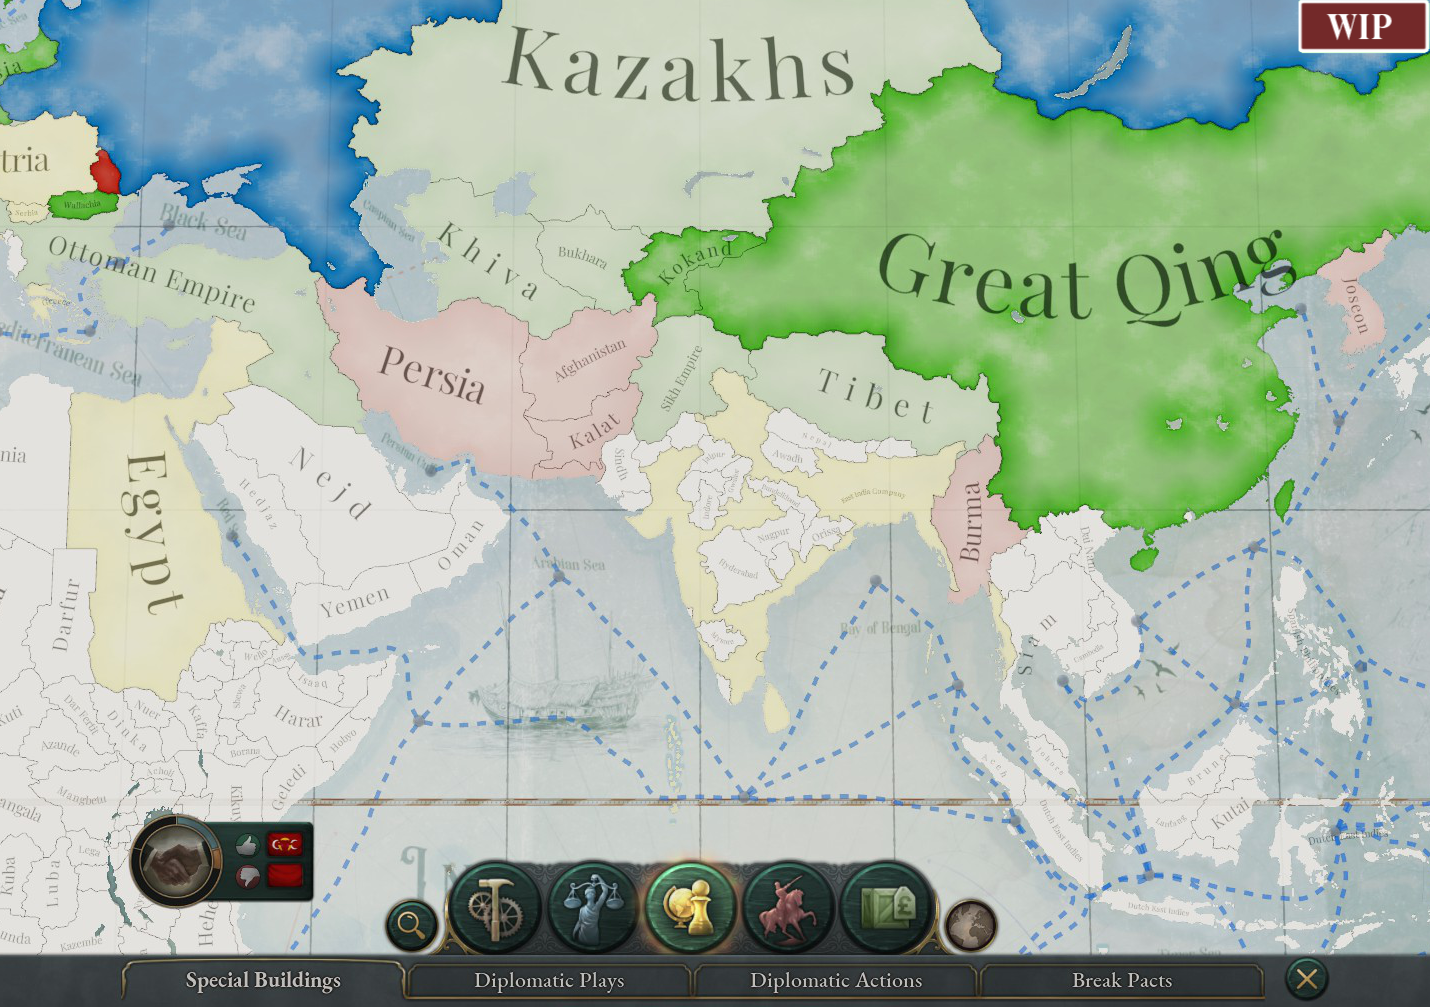
DD29 11 Diplo attitude v2.png


DD29 12 Iron Mines v2.png

Right-Click menus​

The Map Interactions in the Lenses are our take on the Macro Builder, that is when you know what action you want to take and then you select what type of entity to perform that action on. On the other side of the coin, we use Right-Click menus for when you know what entity you want to perform an action on and then select an action from a list of potential actions. We have this for States, Markets, Characters, Buildings, Interest Groups and Goods. So any time you see any of those in the game, you can right-click on them to get a list of actions you can perform.

DD29 13 Right-Click.png

Empty States​

Often forgotten, but extremely important. This is the feedback of dead ends, such as looking at the Urban Buildings tab of a State with no Urban Buildings. A useful empty state will let the player know what’s happening, why it’s happening, and what to do about it. In a State with no Urban Buildings we should of course tell this to the player, but also include the potential Urban Buildings which the player can build in that State. This is only one of many examples and you’d be surprised how often this simple yet important UX design aspect is forgotten. The empty state tells the player what that screen could be populated with and what the player can do about it.

DD29 14 No urban.png

Should you get an economics degree before you play V3?​

Far be it from us to ever discourage anyone from getting an economics degree! Yet, despite Victoria 3's immense depth and complexity, our intention is still to allow you to learn even the most advanced concepts the game is based on as you play. One aspect of this is the tutorial, which we are putting more focus onto than ever before and will cover in detail in a future Dev Diary. Another aspect is through tooltippable Game Concepts, which work much like an integrated dictionary or rule book. Whenever you see such a Concept in text, such as Pops, Dividends Taxes, or Market Price, you can tooltip it to get an explanation of what it means and references to related concepts and mechanics. This powerful tool together with the Nested Tooltips allows us to design and explain anything in the game without writing a novel in each tooltip, and as a player, you can choose to deep dive into any peculiarities as you see fit.

DD29 15 pop tooltip.png

Accessibility features​

Last but not least, we can not talk about UX without mentioning Accessibility and boy are we happy to have something never before seen in any PDS game - Colorblindness mode for text! We have it on our roadmap to make this feature work with more things in the game as well. We have also worked hard to get to a point where the UI scaling should work even better out of the box than previous releases.

Default mode, Tritanopia mode, and Protanopia/Deuteranopia mode
DD29 16 Colorblind 1.png

That’s all for the first dev diary of 2022 folks. What an exciting year we have in front of us with so many tooltips to design and improve on! We’ll be back next week where Kenneth, our 2D Art Lead, will guide you through a closer look at the UI design of Victoria 3. See you then!
 

Attachments

  • 16_9.jpg
    16_9.jpg
    978 KB · Views: 0
  • DD29 01 concept v2.png
    DD29 01 concept v2.png
    1,1 MB · Views: 0
  • DD29 02 numbers v2.png
    DD29 02 numbers v2.png
    382,8 KB · Views: 0
  • DD29 03 menu tooltip.png
    DD29 03 menu tooltip.png
    146,7 KB · Views: 0
  • DD29 04 Graph.png
    DD29 04 Graph.png
    128,6 KB · Views: 0
  • DD29 05 area chart.png
    DD29 05 area chart.png
    234,7 KB · Views: 0
  • DD29 06 pie chart.png
    DD29 06 pie chart.png
    310,2 KB · Views: 0
  • DD29 07 Building details.png
    DD29 07 Building details.png
    898,2 KB · Views: 0
  • DD29 08 Production Methods tooltip.png
    DD29 08 Production Methods tooltip.png
    652,7 KB · Views: 0
  • DD29 09 coal mine.png
    DD29 09 coal mine.png
    408,7 KB · Views: 0
  • DD29 10 Fabric goods heatmap.png
    DD29 10 Fabric goods heatmap.png
    1,4 MB · Views: 0
  • DD29 11 Diplo attitude v2.png
    DD29 11 Diplo attitude v2.png
    1,6 MB · Views: 0
  • DD29 12 Iron Mines v2.png
    DD29 12 Iron Mines v2.png
    1,6 MB · Views: 0
  • DD29 13 Right-Click.png
    DD29 13 Right-Click.png
    1,1 MB · Views: 0
  • DD29 14 No urban.png
    DD29 14 No urban.png
    970,3 KB · Views: 0
  • DD29 15 pop tooltip.png
    DD29 15 pop tooltip.png
    501,3 KB · Views: 0
  • DD29 16 Colorblind 1.png
    DD29 16 Colorblind 1.png
    1,2 MB · Views: 0
  • 201Like
  • 106Love
  • 13
  • 9
  • 2
  • 1Haha
Reactions:
Congratulations on soon becoming a parent (again?) Henrik! I hope you get to enjoy spending your time doing the opposite of looking at a screen.

A couple of thoughts here: Can you look at using mostly stacked bar charts for the default share and magnitude charts? I know that many players are attached to pie charts for probably nostalgia reasons (or the fact that they are a pretty common chart), but most of the research about information displays shows they are pretty ineffective at conveying either scale or relative composition, particularly for anything more than 3 slices. Stacked bar charts are quicker to convey the same data, and it is easier to compare the differences between them, such as population to political power in the DD.

I'm also in the crowd that would like message settings to be available. It sounds like from the developer perspective one of the issues is that if there are a million permutations of the message settings out there it becomes harder to design new features that work well with everyone's settings. A solution might be to create message setting presets, with two basic sets for single player and multiplayer (and the ability to add more for players that like lots of them). I would imagine that most players will leave them on the default letting the devs focus on only two types of basic message settings - one for fast play and one for more deliberate pause heavy play. Then those of us that go in and change things can customize on top of that, and if you alter the base message settings for one of the presets it would flow through to the players if that setting has not been changed from the default. Something tells me most players will stick with what PDX recommends for new features and that people who like futzing with this stuff are going to be more likely to revisit those message settings everytime a new feature is added anyway.
 
  • 12Like
  • 3
Reactions:
Very interesting and useful DD, and I hope there is still time to make changes and work on things. I didn't read the whole thread, so people may have already noted some of these things, but this would be my changes wishlist:

  • In CK3, some events have icons which cause tooltips between other icons that cause tooltips, meaning that if I lock a tooltip in place, I have to fiddle around very carefully with the mouse to avoid spawning another tooltip, which removes the tooltip I locked in place. It would be nice if this doesnt happen in Vicky 3, because it can be quite frustrating. Perhaps this could be solved by adding a type of tooltip lock where the tooltip only goes away if you use a hotkey to remove it.
  • I want to be able to see the values on a line graph when I hover my mouse over it (kind of like the graphs that google produces when you look up population or stock prices), and I want to be able to see the specific value of something at a specific time if I so desire
  • I want to be able to convert the pie charts into tables so I can see every value
  • I want to be able to see percentages on or near the pie charts

I want to second @jespertjee regarding his points on graphs
I also want to second @Merrivale in requesting for modifiable notification settings. We had them as recently as Imperator, which was released less than 3 years ago.

Overall, this looks great! I am very happy about the return of nested tooltips and the addition of accessibility features. Awesome job hagerhink and team!
 
  • 9Like
  • 3
Reactions:
Love the addition of treemaps for showing data. It would especially be an amazing way to display production, consumption, or trade data for countries and states since that's become one of the standard ways trade data is visualized. So many possible applications for it that would be useful in the game.
 
  • 2
  • 1Like
Reactions:
I do like how you added the predicted income of a building if you change or upgrade it. Will this also be present in the macro builder when viewing the world map? This way I can pick the best state to build a building and whether there's enough workers to work there as well.
 
  • 1
Reactions:
Are you going to allow us to filter notifications like in EU4 or CK2, or will we be forced to have a lot of blinking, flashing, (1), icons on our screen that are extremely distracting and annoying like CK3?
 
  • 11
Reactions:
This is so a huge improvement from any paradox game I've played (haven't played CK3). I'm very pleased with all those options we have, the map modes, and it's also great colorblind people will be able to see the information clearly.

Congratulations on being a parent btw.
 
  • 1Like
Reactions:
Small suggestion (assuming it hasn't been done): it'd be nice if hovering over segments of a pie chart told you the percentage to 3 significant figures.
 
  • 9
  • 1Like
Reactions:
Small suggestion (assuming it hasn't been done): it'd be nice if hovering over segments of a pie chart told you the percentage to 3 significant figures.
I'm not sure about the number of significant figures, but that's how it works in Vic2 so I would assume that's how it will work in Vic3 as well.
 
Is there a bug in the prediction for changing the production method for the glassworks? Seems like in order for the tooltip to predict a negative impact to weekly balance, laborers must have a higher wage than shopkeepers.

Producing 50 less porcelain means we'd lose 50*£59.9 = £2995.
Producing 30 more glass means we'd gain 30*£49.9 = £1497.
Using 40 less dye means we'd reduce costs by 40*£46.1 = £1844.

Putting the total change in materials together, we see a net increase of £346.

That must mean that the change in wages is +£372.3, so that laborers have higher wages than shopkeepers by an average of £1.86 per worker.
 
  • 1
Reactions:
Is there a bug in the prediction for changing the production method for the glassworks? Seems like in order for the tooltip to predict a negative impact to weekly balance, laborers must have a higher wage than shopkeepers.

Producing 50 less porcelain means we'd lose 50*£59.9 = £2995.
Producing 30 more glass means we'd gain 30*£49.9 = £1497.
Using 40 less dye means we'd reduce costs by 40*£46.1 = £1844.

Putting the total change in materials together, we see a net increase of £346.

That must mean that the change in wages is +£372.3, so that laborers have higher wages than shopkeepers by an average of £1.86 per worker.
I believe that may be that the prices will also be expected to change after this change. So the price of glass will do down due to higher supply, and you will actually generate less than £1497. If this is the case it should be indicated somewhere perhaps with an arrow up/down on each of the prices listed.

Alternatively whenever prices are listed somewhere it would be useful to have a quick sparkline or arrow indicator for the price trend. In this example, it might lose money in the short term at current prices, but if the price of glass is rapidly increasing or the price of porcelain is dropping this might make more sense.
 
  • 2
  • 1Like
Reactions:
I believe that may be that the prices will also be expected to change after this change. So the price of glass will do down due to higher supply, and you will actually generate less than £1497. If this is the case it should be indicated somewhere perhaps with an arrow up/down on each of the prices listed.

Alternatively whenever prices are listed somewhere it would be useful to have a quick sparkline or arrow indicator for the price trend. In this example, it might lose money in the short term at current prices, but if the price of glass is rapidly increasing or the price of porcelain is dropping this might make more sense.
Additionally you will lose 200 high wage shopkeepers who are probably the primary consumers of luxury goods like glass and porcelain.
 
I don't consider this even super bad idea, although to make it truly useful, it should be real time stream of data, something which is not an excel's thing. You would need some other ap that runs on secondary monitor. Also, this would possibly mean that importing them to file is clumsy way of doing it. Unless, of course, you open the file in readonly mode and then press reload button or something.
or have a setting to export once a week/month. So it can basically be done with auto save files, and some script parsing the data into CSV with the info you want, and then an Excel template that generate graph from this data formate
 
  • 1Like
Reactions:
This is actually one of the most important dev diaries. I am not exaggerating when I say that the UX has a bigger impact on my enjoyment of a game than the game mechanics do.
With that in mind, I agree with everyone else who wants message settings and I'm disappointed that there's no mention of them in this diary. All the other UX features look nice, but they're not enough to compensate for the lack of message settings.
This relates to the first UX pillar, "The right information at the right time". If I don't get notified of something I want to be notified of, or if I get notified of something I don't want to be notified of, then I am not getting the right information. And the information that players want is different for each player, hence the importance of customizable notifications. Furthermore, if I can't read and respond to an event on the exact tick that it happens, then as far as I'm concerned, I'm not getting that information at the right time, hence the importance of auto-pause.
 
  • 14
Reactions:
I believe that may be that the prices will also be expected to change after this change. So the price of glass will do down due to higher supply, and you will actually generate less than £1497. If this is the case it should be indicated somewhere perhaps with an arrow up/down on each of the prices listed.

Alternatively whenever prices are listed somewhere it would be useful to have a quick sparkline or arrow indicator for the price trend. In this example, it might lose money in the short term at current prices, but if the price of glass is rapidly increasing or the price of porcelain is dropping this might make more sense.
I agree that the prediction tooltip should display a projected price of the good being produced and use that future price to calculate the predicted change in weekly balance, although that may be asking for a bit much.

It should at least show change in wages in the same tooltip.

Instead of a arrow or sparkline a la Vicky 2, I'd like to be able to hover over a good and get a tooltip of a direct graph of its price against time.