There is no exact formula for the ratio of types and number of resources in original Hoi Games.
All resources are made very rudely, careless and unrealistic, both in number and in their location in the provinces.
Therefore, if you want to have the resource map that corresponds to 1936-1945 REALITY, you must make it yourself and do not hope on Hoi developers.
I did it.
I will not be falsely humble - I am the only one who has implemented the most accurate number and location of resources on the Hoi map.
No one other game has and never will have such accuracy in resources as my Mod have.
I used next ratios:
1 'drop' of Oil = OR 100 tons of crude Oil = OR 100 tonns of Mazut (Fuel oil
) = OR 40 tons of Light Fuel
1 'drop' of Oil on Map = OR 36 000 tons of crude Oil per year = OR 14 400 tons of Light Fuel per year
1 mln kW of hydropower generation = 60 Energy on Map
100 МW of hydropower generation = 6 Energy on Map
1 mln tons of Coal per year = 5 Energy on Map
1 Energy on Map = 200 000 tons of Coal per year
1 Energy = 556 tons of Coal
1 Coal = 2 brown (Lignite) Coal
1 mln tons of Iron Ore (with 45% Fe) per year = 18 Metal on Map
1 Iron Ore on Map = 55 555 tons of Iron Ore (with 45% Fe) per year
1 Metal = 154 tons of Iron Ore (with 45% Fe) = 69 tons of 100%Fe Concentrate
Iron ore deposits usually have anywhere from 30 to 60 percent of iron content. Putting the ore on the Map you must take into account this percentage of Ferrum concentration in these ore mines.
For example 60%Fe ore (Sweden) contains twice more Metal than 30%Fe ore (Germany)
10 000 tons of natural rubber per year = 5 Rares on Map.
1 Rare on Map = 2 000 tons of natural rubber per year
1 Rare = 5,5(5) tons of natural rubber
Important to know.
At this time, there were only two mass technologies of the production of synthetic rubber - from Coal in Germany and from Potatoes (from ethanol) in USSR.
If in your game synthetic rubber in 1933-1945 produced from 'Oil' - throw your game in the trash.
By my 'rares'-conception for Hoi-2, around 25% of all Rares (totally there are around 1900 rares on all Map) are Rubber.
Other 75% of Rares are other 13 key rare metals.
Rubber - 25% of Rares = 500 Rares on Map
90% of all Rubber located in Asia.
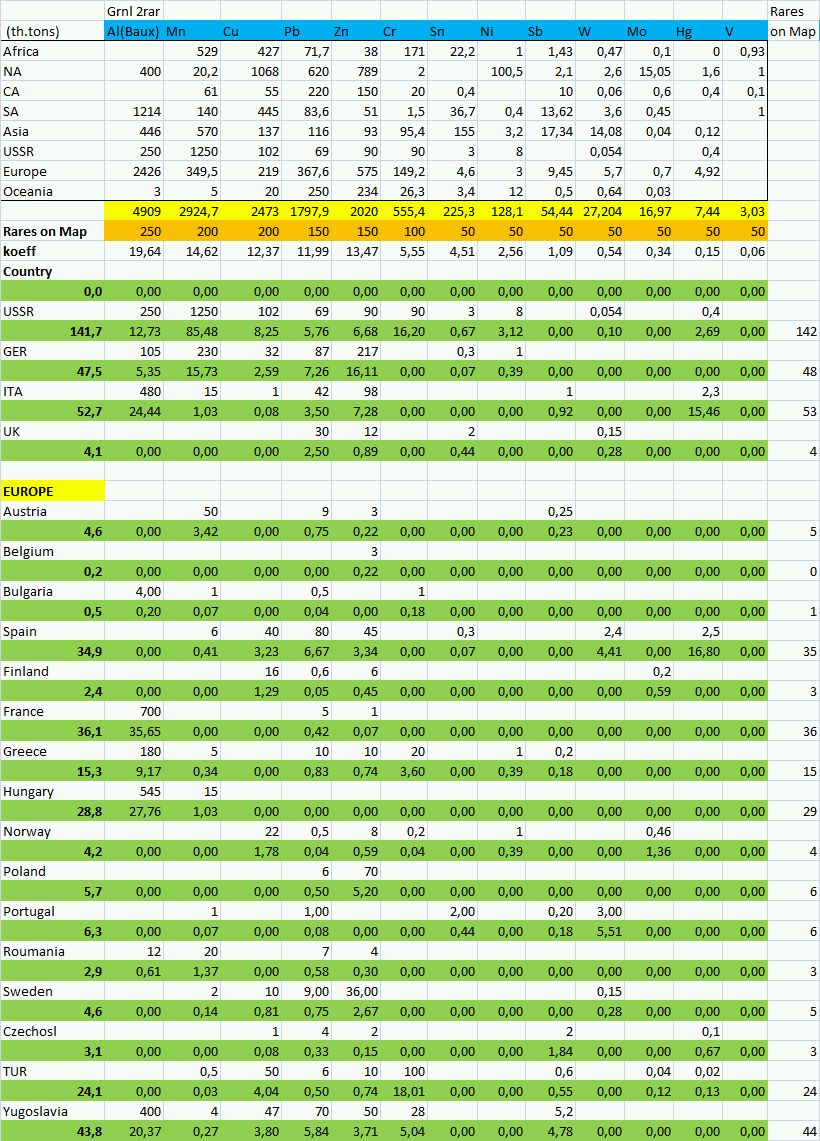
Other 13 key rare metals:
Al (Baux Ore)
Mn - Manganese Ore
V - Vanadium Ore
Mo - Molybdenum Ore
W - Tungsten Ore
Cu - Copper Ore
Pb - Lead Ore
Zn - Zinc Ore
Sn - Tin Ore
Ni - Nickel Ore
Сr - Chrome Ore
Sb - Antimony Ore
Hg - Quicksilver
Here's an example of the number of Rares for Europe, based on real 1936-1941 economical statistic.
Of course, ideally, it is better to allocate rubber and rare metals in separate groups, but I work with that Hoi-2 engine, which we have - with all rares mixed into one pile.